History Graphs for ,
High Temperature
Low Temperature
27.8°C
5.9°C

High Humidity
Low Humidity
93%
30 %
High Dewpoint
Low Dewpoint
14.4°C
1.1°C
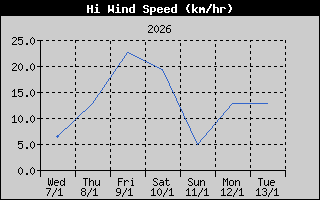
High Wind Speed
27.4 km/hr
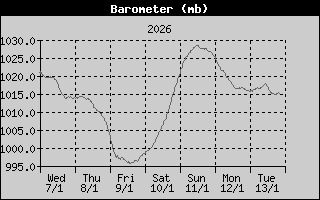
High Barometer
Low Barometer
1021.9 mb
1007.0 mb
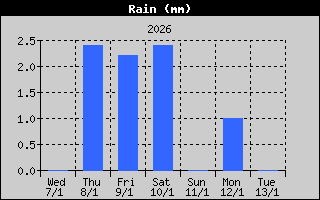
Rain Total
26.8 mm
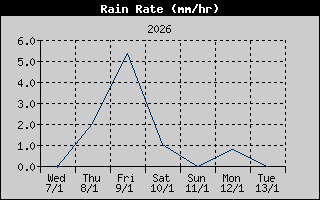
High Rain Rate
37.6 mm/hr
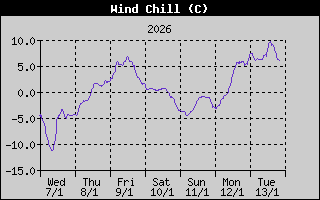
Low Wind Chill
6.1°C
High Heat Index
27.2°C
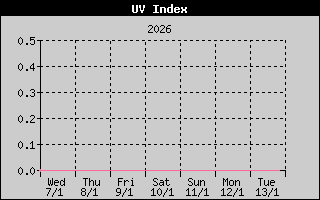
High UV
3.4 index
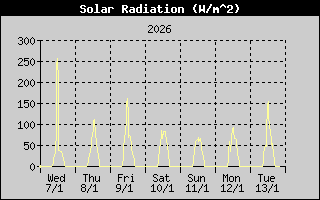
High Solar Radiation
865 W/m˛
High Temperature
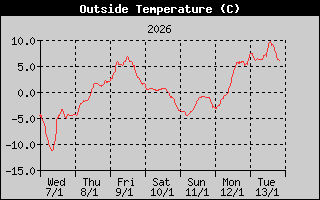
Low Temperature
27.8°C
-7.2°C
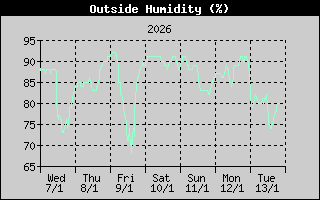
High Humidity
Low Humidity
94%
30%
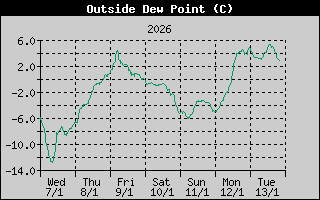
High Dewpoint
Low Dewpoint
14.4°C
-9.4°C
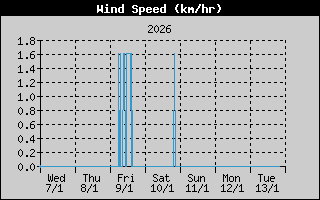
High Wind Speed
51.5 km/hr
High Barometer
Low Barometer
1044.2 mb
995.5 mb
Rain Total
136.2 mm
High Rain Rate
37.6 mm/hr
Low Wind Chill
-7.2°C
High Heat Index
27.2°C
High UV
3.4 index
High Solar Radiation
991 W/m˛